showme
Simple visualization tool for FESOM data.
Basic usage
As minimum you should provide path to the mesh and path to the file:
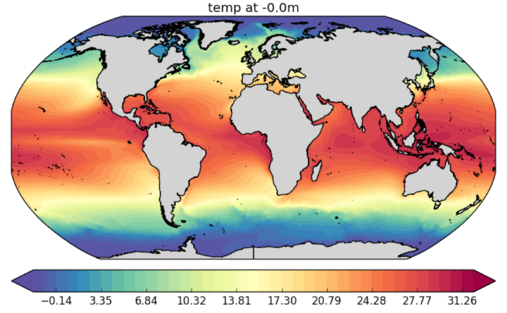
python showme.py /path/to/mesh/ /path/to/file.nc
You will get an image of global distribution of temperature (temp) at the first time step and smallest depth:
To control different aspects of your plot you can provide additional options. For example this line:
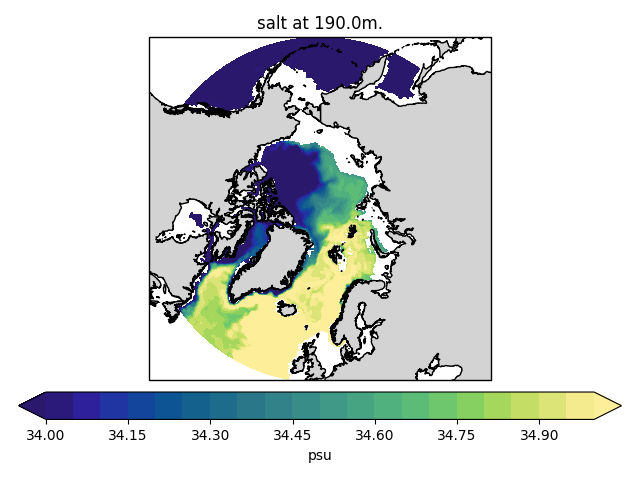
python showme.py -m np -b -180 180 50 90 -d 200 -l 34 35 21 --cmap haline /path/to/mesh/ /path/to/file.nc salt
will creaate image in the North Polar Stereo projection (-m np), with lon/lat boundaries of -180/180/50/90 (-b -180 180 50 90) ad 200 m depth (-d 200) with color levels spanning from 34 to 35 with 21 step (-l 34 35 21) and haline colormap from cmocean package (–cmap haline). The property to plot is salt (at the end of the line).
Usage and options
Below you can find complete list of options. You can allways display this list in the terminal by executing:
python showme.py --help
Usage: showme.py [OPTIONS] MESHPATH IFILE [VARIABLE]

meshpath - Path to the folder with FESOM1.4 mesh files.

ifile    - Path to FESOM1.4 netCDF file.

variable - The netCDF variable to be plotted.

Options:
-d, --depth FLOAT               Depth in meters.  [default: 0]
-b, --box <INTEGER RANGE INTEGER RANGE INTEGER RANGE INTEGER RANGE>...
                                Map boundaries in -180 180 -90 90 format.
                                [default: -180, 180, -80, 90]
-r, --res <INTEGER INTEGER>...  Number of points along each axis (for lon
                                and  lat).  [default: 360, 170]
-i, --influence INTEGER         Radius of influence for interpolation, in
                                meters.  [default: 80000]
-t, --timestep INTEGER          Timstep from netCDF variable, strats with 0.
                                [default: 0]
-l, --levels FLOAT...           Levels for contour plot in format min max
                                numberOfLevels. If not provided min/max
                                values from data will be used with 40
                                levels.
-q, --quiet                     If present additional information will not
                                be printed.
-o, --ofile PATH                Path to the output figure. If present the
                                image will be saved to the file instead of
                                showing it.
-m, --mapproj [merc|pc|np|sp|rob]
                                Map projection. Options are Mercator (merc),
                                Plate Carree (pc), North Polar Stereo (np),
                                South Polar Stereo (sp),  Robinson (rob)
                                [default: rob]
--abg <FLOAT FLOAT FLOAT>...    Alpha, beta and gamma Euler angles. If you
                                plots look rotated, you use wrong abg
                                values. Usually nessesary only during the
                                first use of the mesh.  [default: 50, 15,
                                -90]
-c, --clim [phc|woa05|gdem]     Select climatology to compare to. If option
                                is set the model bias to climatology will be
                                shown.
--cmap TEXT                     Name of the colormap from cmocean package or
                                from the standard matplotlib set. By default
                                `Spectral_r` will be used for property plots
                                and `balance` for bias plots.
--interp [nn|idist|linear|cubic]
                                Interpolation method. Options are nn -
                                nearest neighbor (KDTree implementation,
                                fast), idist - inverse distance (KDTree
                                implementation, decent speed), linear (scipy
                                implementation, slow) and cubic (scipy
                                implementation, slowest and give strange
                                results on corarse meshes).  [default: nn]
--ptype [cf|pcm]                Plot type. Options are contourf ('cf') and
                                pcolormesh ('pcm')  [default: cf]
-k INTEGER                      k-th nearest neighbors to use. Only used
                                when interpolation method (--interp) is
                                idist  [default: 5]
--help                          Show this message and exit.