showo
Shows FESOM data on original grid.
Basic usage
As minimum you should provide path to the mesh and path to the file:
python showo.py /path/to/mesh/ /path/to/file.nc
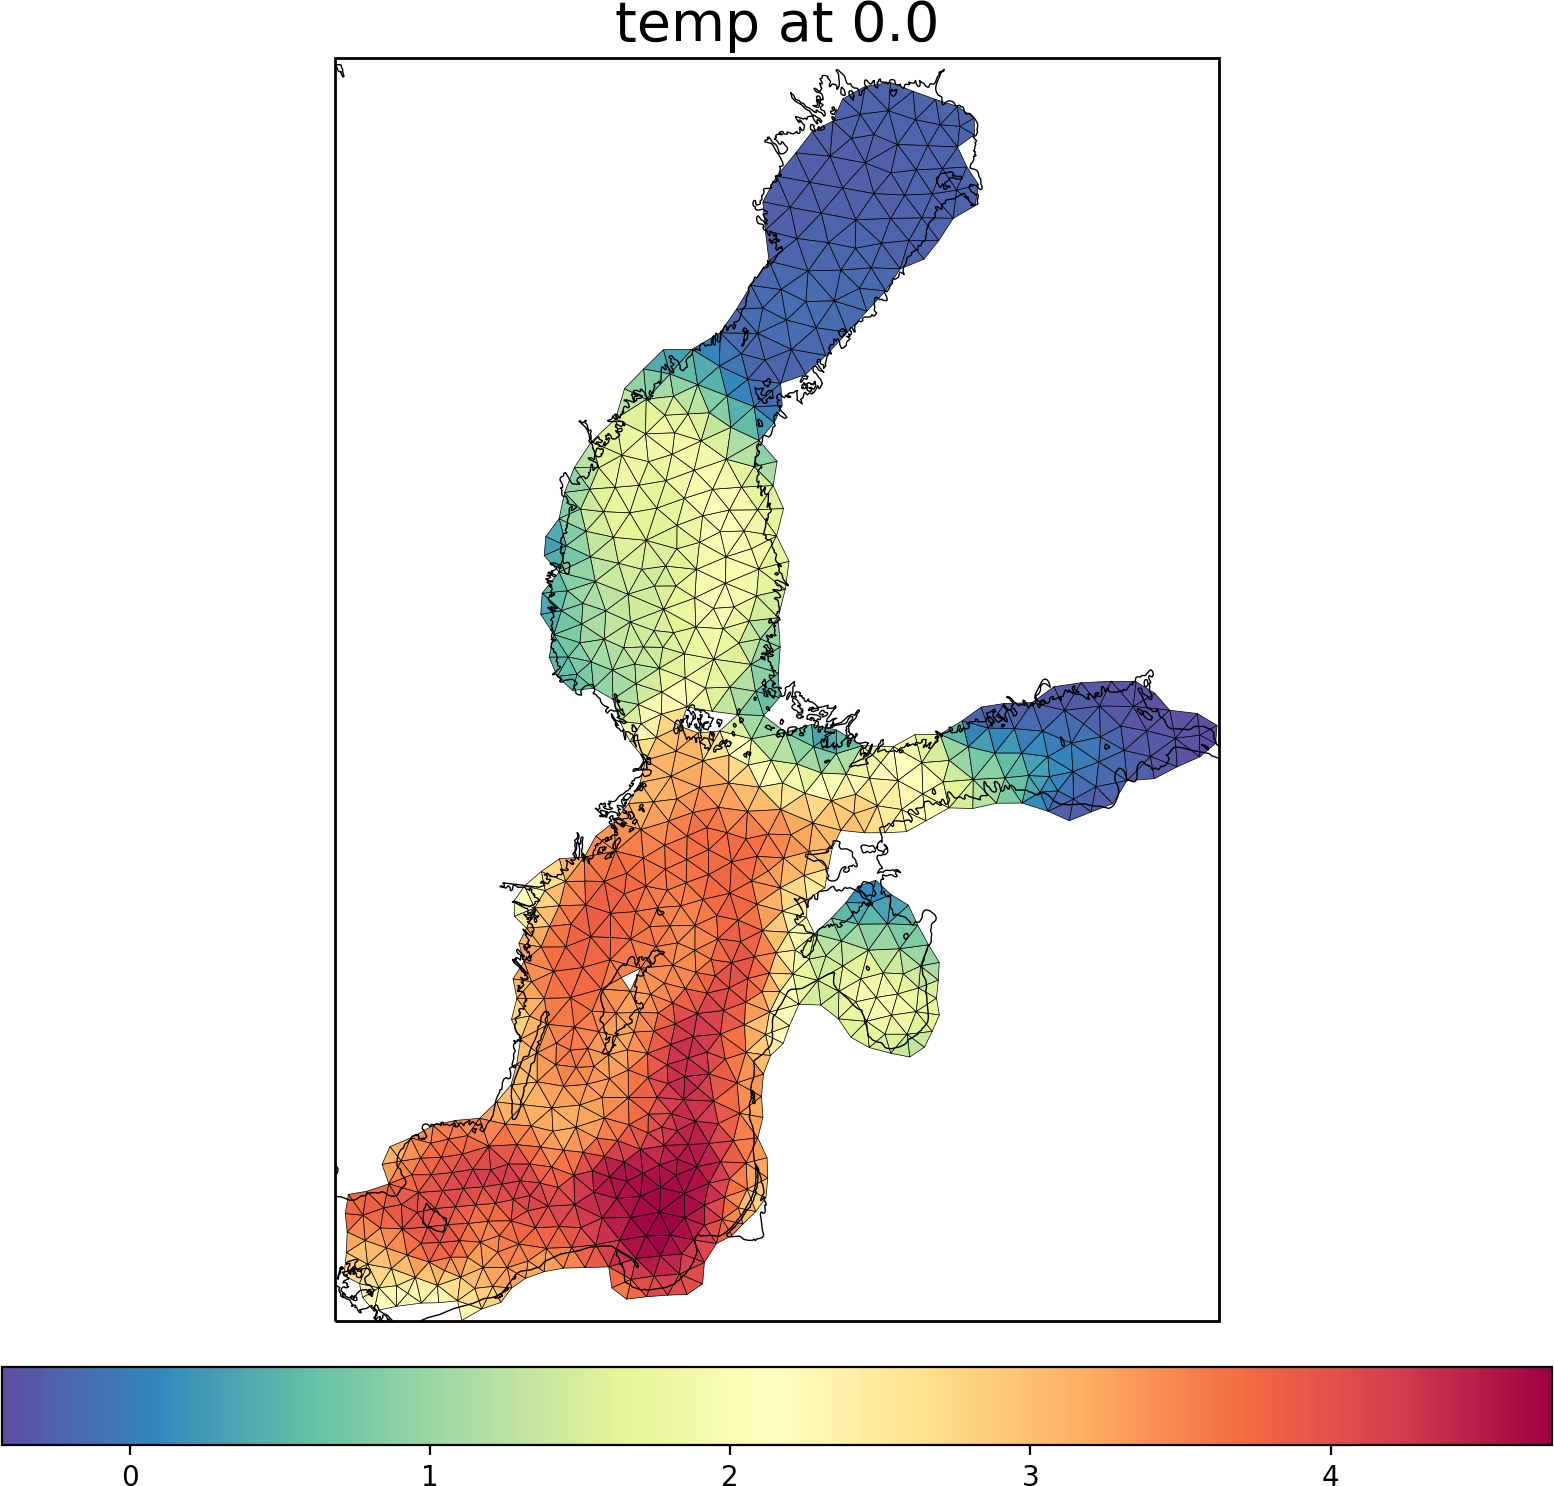
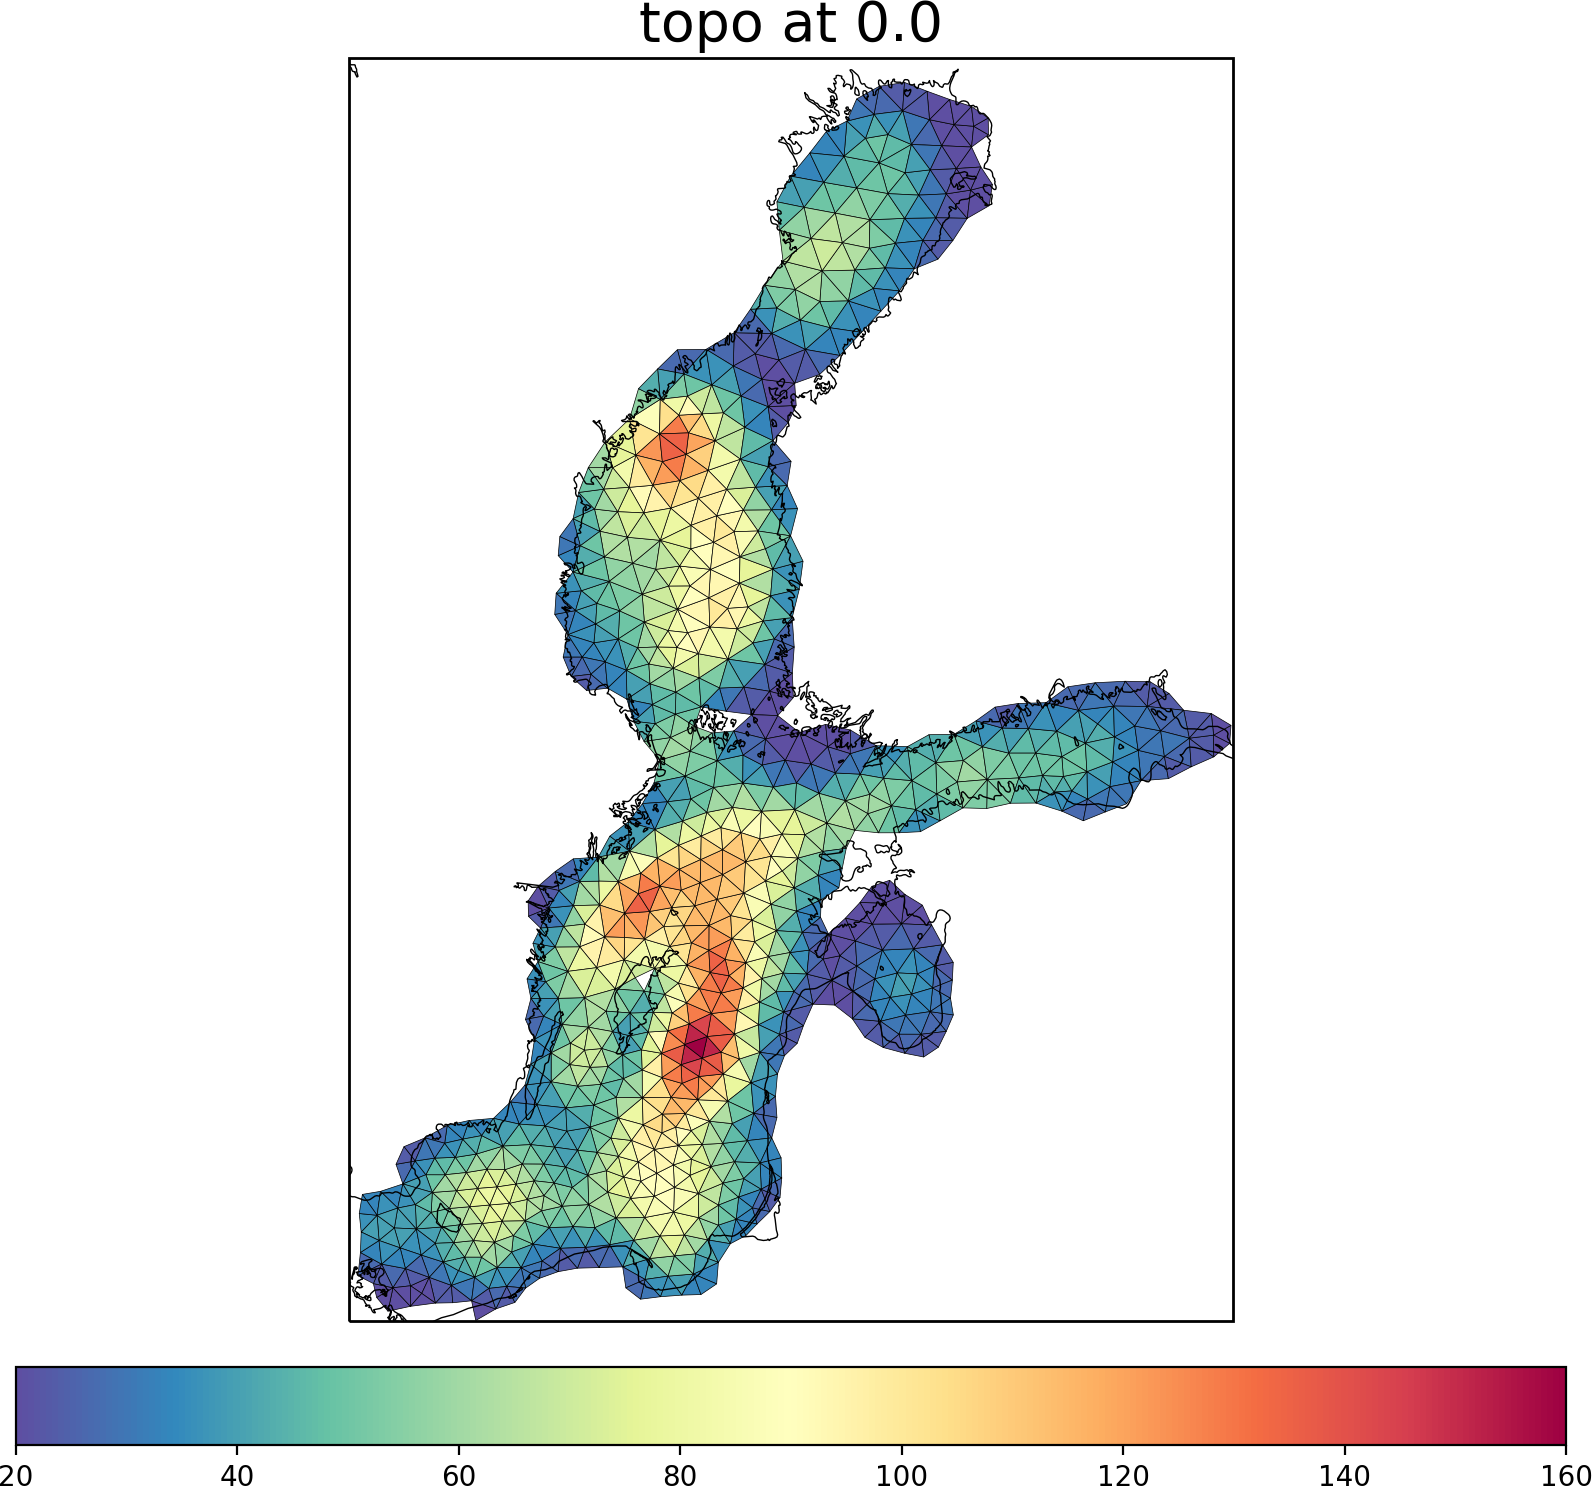
By default it will produce plot of the Baltic Sea temperature oh original grid. Quite often you youl like to plot topography on original grid - to do so, just provide topo as variable argument:
python showo.py /path/to/mesh/ /path/to/file.nc topo
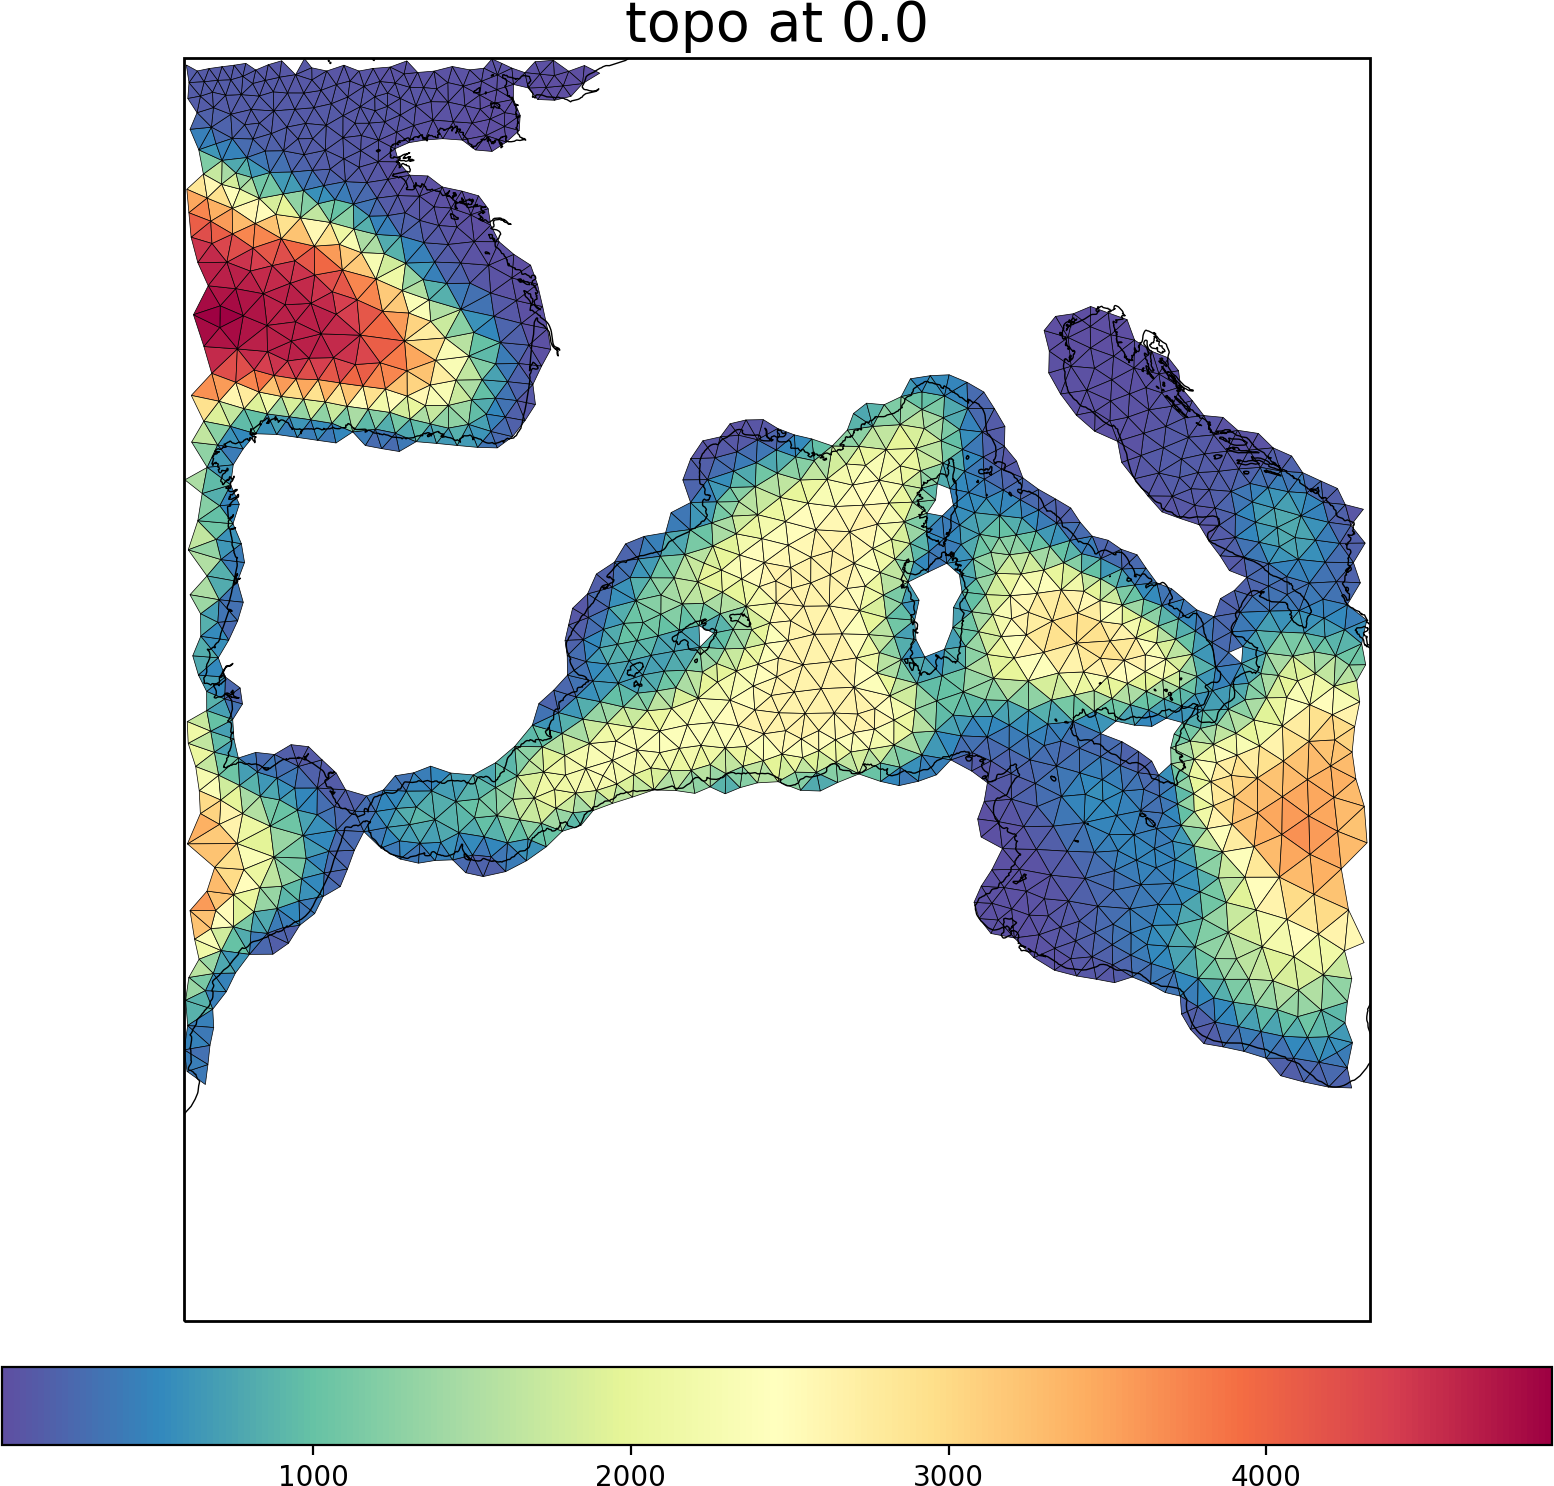
One can easliy change the region and get the following result:
python showo.py -b -10 20 25 50 /path/to/mesh/ /path/to/file.nc topo
Usage and options
Below you can find complete list of options. You can allways display this list in the terminal by executing:
python showo.py --help
Usage: showo.py [OPTIONS] MESHPATH IFILE [VARIABLE]

meshpath - Path to the folder with FESOM1.4 mesh files.

ifile    - Path to FESOM1.4 netCDF file.

variable - The netCDF variable to be plotted.

Options:
-d, --depth FLOAT               Depth in meters.  [default: 0]
-b, --box <INTEGER RANGE INTEGER RANGE INTEGER RANGE INTEGER RANGE>...
                                Map boundaries in -180 180 -90 90 format.
                                [default: 13, 30, 54, 66]
-t, --timestep INTEGER          Timstep from netCDF variable, strats with 0.
                                [default: 0]
-l, --minmax INTEGER...         Minimun and maximum values for plotting.
-m, --mapproj [merc|pc|np|sp|rob]
                                Map projection. Options are Mercator (merc),
                                Plate Carree (pc), North Polar Stereo (np),
                                South Polar Stereo (sp),  Robinson (rob)
-q, --quiet                     If present additional information will not
                                be printed.
-o, --ofile PATH                Path to the output figure. If present the
                                image will be saved to the file instead of
                                showing it.
--help                          Show this message and exit.